Lesson 1: Introduction to Analytics
What is data and why do we need to analyse it?
Data is everywhere. We see it and use it every day – on our smartphones, tablets, and laptops.
Data is individual units of information which, on their own, are not very useful. This is unstructured data. By analysing data, however, we can obtain key insights that lead us to make better decisions which, in turn, can add value and innovation to what we do.
Data analytics involves retrieving large volumes of data, organizing it, and extracting information which we can use to achieve better results. Businesses and organisations in all areas of industry are spending more and more money on data analytics to ensure that the information at their fingertips is being used to drive business outcomes.
How does data analysis work?
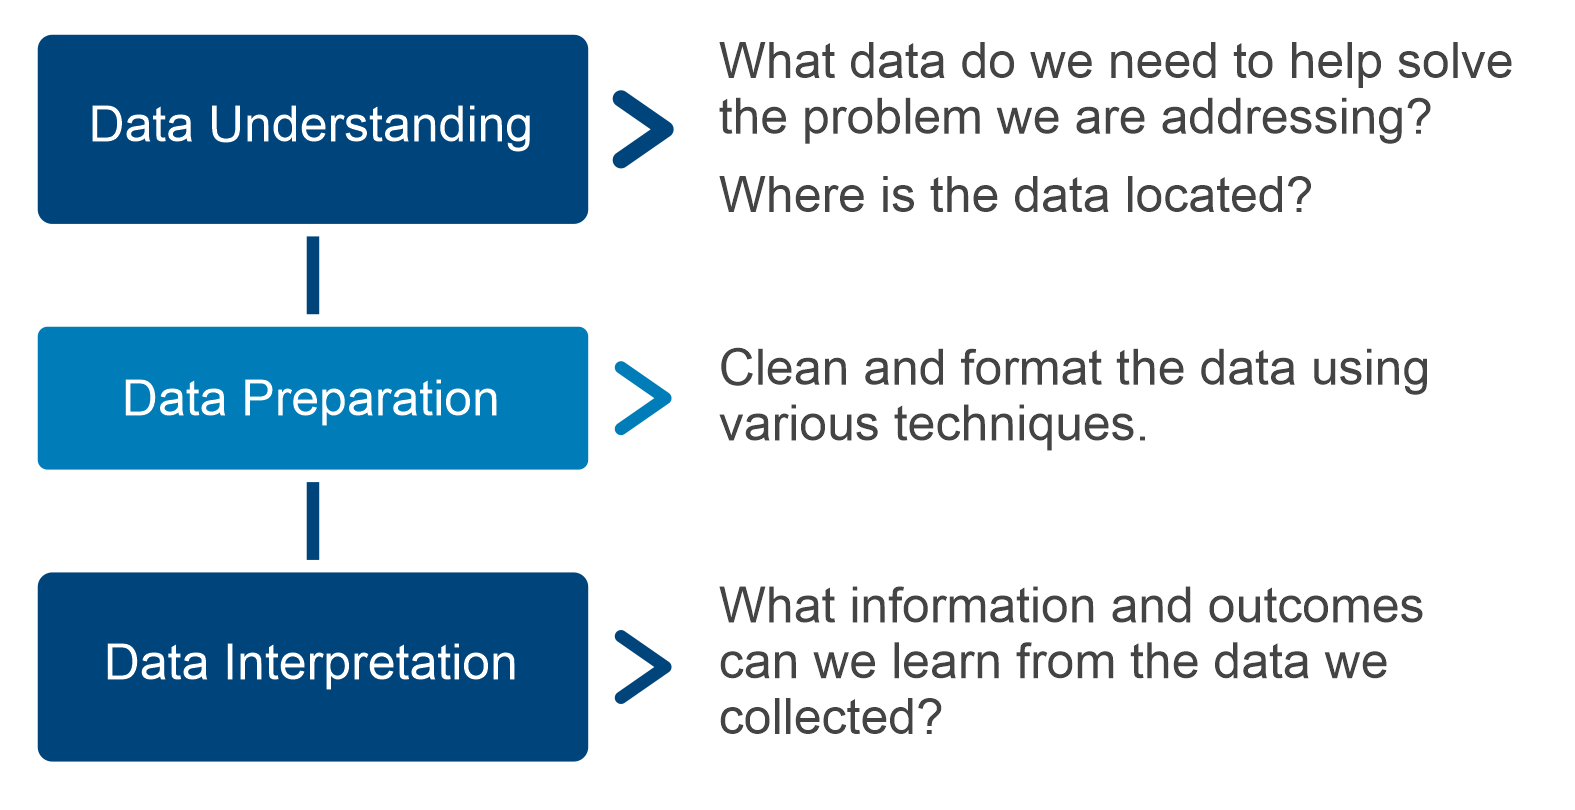
Data analysis is broken down into a number of stages. In this course, we will examine the following stages:

Kaggle and Jupyter Notebook
Kaggle is an online platform and community that is used by data science contributors in the field of data analytics. It is often used to find and upload interesting datasets and to collaborate with others for fun or for competitions.
When we are analysing a dataset or multiple datasets, the best tool to use is Jupyter Notebook. This is a web-based environment that is divided into cells, with each cell containing executable code that is used for data analytics. On Kaggle, there is an embedded Python Jupyter Notebook which can be accessed using any web browser. Being based on a web browser means that multiple people can collaborate on a project at the same time.
How can I interact with a Jupyter Notebook on Kaggle, and what are some basic operations?
To use Jupyter Notebook on Kaggle, you must first either create a new notebook or collaborate on one that has already been created. Using the Edit button at the top-right of the page, you can add or remove code or markdown text, run a selection of code or run entire notebooks. The output will be printed inline within the notebook itself for easy accessibility. Notebooks can be private to a certain group of people, or they can be public to share with all users of the Kaggle site.
How can I access a sample Jupyter Notebook being hosted on the Kaggle website?
As part of this Data Analytics course, we have included a sample notebook related to multiple Spotify datasets and have made it public facing. This means that you can make changes to understand Jupyter Notebooks functionality and test out data analysis concepts in a live environment. This notebook and the data included is a good way to understand the Spotify usage based on these datasets that have been collected.
The Jupyter Notebook is hosted by the Kaggle website and can be accessed using the following link:
kaggle.com/dellteckno/spotify1