Lesson 2: Machine Learning
Introduction to Machine Learning
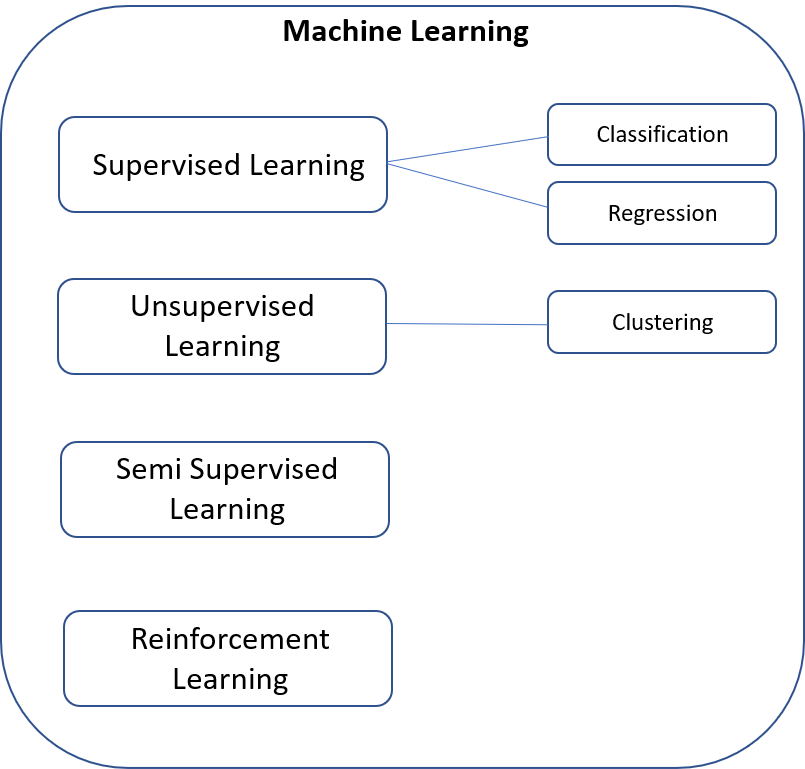
An important area of AI is Machine Learning (ML), which provides a way for a system (often referred to as a model) to infer new knowledge about data.

Supervised Learning
Supervised Learning algorithms rely on data that is labelled before it is used for training a model. The model is shown lots of data that has been validated, either manually or otherwise, so that it can inspect new unseen data and make a recommendation.
Supervised learning has two subcategories:
- Classification - A method that predicts the category of objects based on training data. For example, categorising an email as Spam or not Spam.
- Regression - A method that predicts a number based on past data.For example, predicting a house price based on number or rooms, square footage, and garden.
Unsupervised Learning
Unsupervised Learning algorithms do not have pre-labelled data. The model must learn patterns from the data by grouping similar data points together. This approach is particularly effective with large datasets.
Clustering is often used for fraud detection where anomalies can be detected as distinct clusters. A sample of clustering is below.
Semi Supervised Learning
Semi Supervised Learning is a combination of supervised and unsupervised learning. This approach typically involves a small set of labelled data and a larger set of unlabelled data. Semi supervised learning is used with large datasets when it might not be practical to manually label all the data.
An example is text processing, where huge volumes of text must be classified. A sample set of documents is classified and the model classifies the rest by inferring new knowledge about the data.
Reinforcement Learning
In this approach, the model is rewarded for good decisions and penalised for bad ones. The end goal is a model that learns the best policy by itself.
Reinforcement learning has enabled models to learn the rules of games such as Chess and Go and perform at such a high level that they can defeat Grand Masters. See AlphaGo for an exciting example.
Clustering Demo
This Demo is based on data from {" "}WorldAthletics. It shows the fastest single times for male athletes over the 100M distance along with the age of the athletes.
Question: How can clustering be used to group performances of athletes and to highlight any oddities?
How does the Demo work?
This Demo uses a simple K-Means algorithm. It works as follows:- Initial cluster centers (two or three) are chosen at random and shown as stars on the chart.
- Each point is assigned a cluster and painted with the cluster colour.
- Adjust centres to the centre of all the points in the cluster.
- Repeat five times and show the changes on the chart.
Things to consider
- What kind of groupings were made with two clusters?
- How did using three clusters differ from using two clusters?
- Could this technique be useful for detecting potential cheats?